Creating a Custom ETW EventSource for Debugging High-Performance Code in C#
- Step 1 - Install PerfView
- Step 2 - Install the
Microsoft.Tracing.EventSourceNuGet Package - Step 3 - Subclass
Microsoft.Diagnostics.Tracing.EventSource - Step 4 - Record Events Using Your Custom
EventSource - Step 5 - Use PerfView to Profile Your App and Record Your Custom ETW Source
- Step 6 - Review Your Results in PerfView
One of the things I’ve been working on for both Helios and Akka.NET is a custom ThreadPool implementation that allows us to isolate mission-critical code from the noise of the CLR ThreadPool.
My second pass at implementing one of these instanceable thread pools had me borrow the work-stealing queue implementation that’s been responsible for dramatic performance improvements in the CLR ThreadPool. The original ThreadPool code is very optimized and relies on native calls internally, so it’s not always easy to follow.
My initial performance numbers for DedicatedThreadPool were absolutely awful, so I needed to find a high-performance way of measuring just how well this work queueing structure was working for me.
Enter Event Tracing for Windows (ETW.) I spent way more time than I care to admit trying to figure out how to make this work for me. I’m going to spare you the agony of figuring all of this stuff out by yourself and give you an easy step by step guide on how to record and view your own events in ETW.
Step 1 - Install PerfView
PerfView is a free tool from Microsoft for doing software performance analysis, and it works great with ETW. Download a copy of it and unzip PerfView.exe somewhere where you can find it again easily.
Step 2 - Install the Microsoft.Tracing.EventSource NuGet Package
I could not figure out, for the life of me, how to use the rest of this technique using the System.Tracing.EventSource library built into .NET - and after much researching I was told to just use this NuGet package.
PM> Install-Package Microsoft.Diagnostics.Tracing.EventSource -Pre
This package will give you compile-time validation if you’re wiring up your EventSource classes correctly and even ships with a handy guide which explains how to use all of the EventSource features in their entirety.
Step 3 - Subclass Microsoft.Diagnostics.Tracing.EventSource
This is how you define your custom EventSource and all of the events that will show up in PerfView. Here’s the one I used for profiling our DedicatedThreadPool.
[EventSource(Name = "DedicatedThreadPool")]
internal sealed class DedicatedThreadPoolSource : EventSource
{
    internal static class DebugCounters
    {
        public static readonly AtomicCounter StealCounter = new AtomicCounter(0);
        public static readonly AtomicCounter StealMissCounter = new AtomicCounter(0);
        public static readonly AtomicCounter GlobalHitCounter = new AtomicCounter(0);
        public static readonly AtomicCounter GlobalMissCounter = new AtomicCounter(0);
        public static readonly AtomicCounter LocalHitCounter = new AtomicCounter(0);
        public static readonly AtomicCounter LocalMissCounter = new AtomicCounter(0);
    }

    public void Message(string message)
    {
        WriteEvent(1, message);
    }

    public void StealHit()
    {
        WriteEvent(2, DebugCounters.StealCounter.GetAndIncrement());
    }

    public void StealMiss()
    {
        WriteEvent(3, DebugCounters.StealMissCounter.GetAndIncrement());
    }

    public void GlobalQueueHit()
    {
        WriteEvent(4, DebugCounters.GlobalHitCounter.GetAndIncrement());
    }

    public void GlobalQueueMiss()
    {
        WriteEvent(5, DebugCounters.GlobalMissCounter.GetAndIncrement());
    }

    public void LocalQueueHit()
    {
        WriteEvent(6, DebugCounters.LocalHitCounter.GetAndIncrement());
    }

    public void LocalQueueMiss()
    {
        WriteEvent(7, DebugCounters.LocalMissCounter.GetAndIncrement());
    }

    public void ThreadStarted()
    {
        WriteEvent(8);
    }

    public static readonly DedicatedThreadPoolSource Log = new DedicatedThreadPoolSource();
}
When you make a call to WriteEvent, you must pass in a unique ID (int) for each different type of event you want to record.
For high-performance events like these (clocking thread queuing behavior) I recommend using small data types for your event state - integers.
I also recommend using the EventSource attribute on your class like this, to give it a friendly name:
[EventSource(Name = "DedicatedThreadPool")]
You’re going to have to use this name to look up ETW events in PerfView, so it’s a little bit easier if you manually assign it a name rather than depending on the conventions generated by the compiler.
You might have also noticed this:
public static readonly DedicatedThreadPoolSource Log = new DedicatedThreadPoolSource();
I’m using a singleton here because this makes it a lot easier to actually log events throughout my code.
Step 4 - Record Events Using Your Custom EventSource
Now we just need to record some of the events we defined on the DedicatedThreadPoolSource class. It looks like this:
[SecurityCritical]
internal void MarkThreadRequestSatisfied()
{

#if HELIOS_DEBUG
    DedicatedThreadPoolSource.Log.ThreadStarted();
#endif
  // rest of method...
}
Easy!
Step 5 - Use PerfView to Profile Your App and Record Your Custom ETW Source
Now for the next part - actually recording your metrics - you can do this easily through PerfView.exe by doing the following.
In PerfView.exe, go to Collect –> Run and grant it Admin rights when asked.
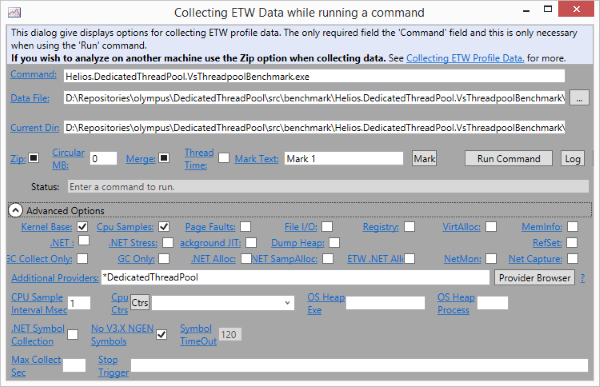
Set the path to your own app where you’ve defined your EventSource, but most importantly - you need to specify the following under Additional Providers:
*DedicatedThreadPool
This is the name we gave our DedicatedThreadPoolSource via the EventSource application earlier - and we must put the * in front of it in order for PerfView to pick up its events.
Once this is done, press the Run Command button and you should see the following:
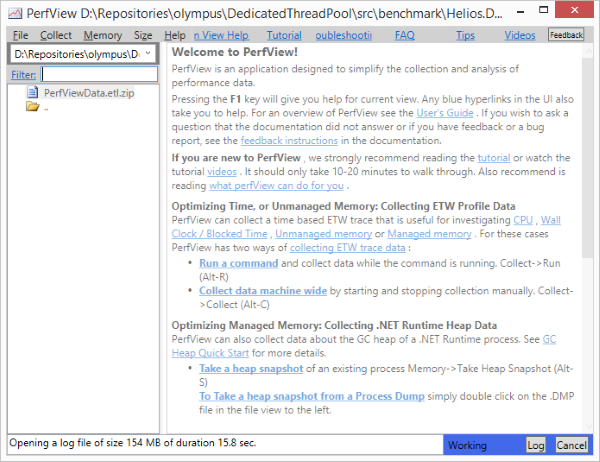
The bottom-right corner will continue to flash for a bit until the profiling is complete. Once it’s done you’ll be able to view the results.
Step 6 - Review Your Results in PerfView
After PerfView is finished collecting its data, you should see the left-hand panel fill up with new items for you to review.
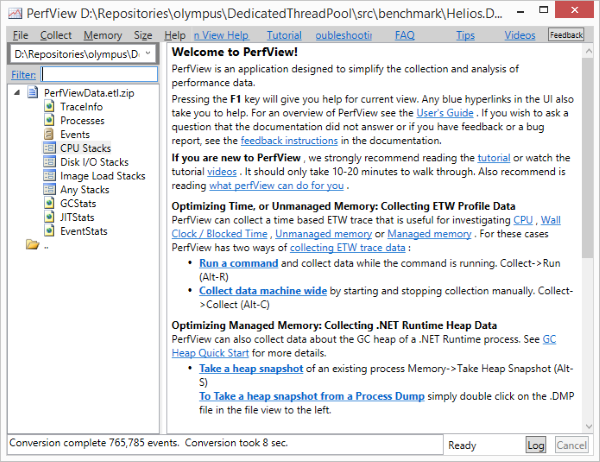
Your custom events will show up under Events and EventStats. Personally, I like to take a look at EventStats first just to gauge how frequently each custom event was hit.
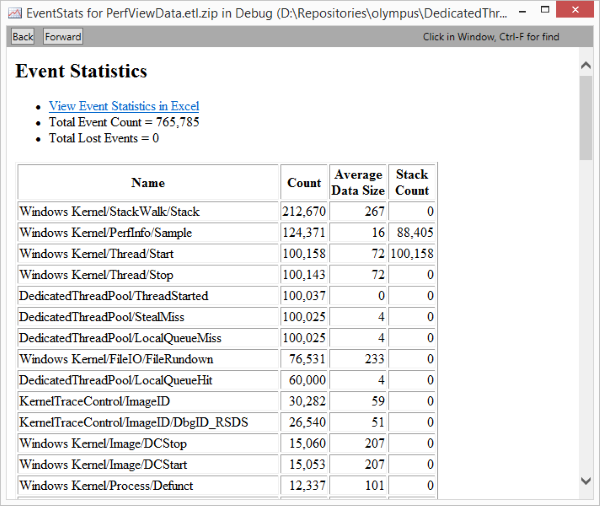
You can see our DedicatedThreadPool events sprinkled throughout the list.
Now go give this a shot yourself!
Discussion, links, and tweets
I'm the CTO and founder of Petabridge, where I'm making distributed programming for .NET developers easy by working on Akka.NET, Phobos, and more..
Tweet Follow @Aaronontheweb